Sea level rise is caused by two factors related to global warming: the added water coming from the melting of land ice, and the expansion of sea water as it warms up (thermal expansion). During the period 2003-2008 the average rate of sea level rise has been 2.5 mm/yr, a smaller scale than the period 1993-2003 (3.1 mm/yr). The contribution of different factors involved in sea level rise has changed in the latest period, so for the period 2003-2008 80% of the sea level rise is due to the contribution of the polar ice sheets and mountain glaciers melting while thermal expansion contributed 50% of sea level rise for the period 1993-2003 (Cazenave et al. 2008). Future changes in the climate will accelerate the sea level rise. The IPCC did not include the full dynamic ice sheet responses in their projections, so its estimated sea level rise from 18-59 cm by 2100 is considered as conservative (WWF 2008). However, estimations from assessments and ice loss projections in Greenland and in West Antarctica suggest a sea level rise from 0.8 to 2 meters by 2100 (Pfeffer et al. 2008).
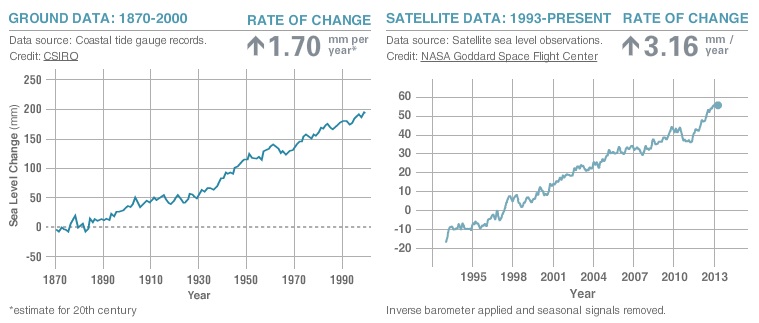
Figure 10. Sea level rise is caused by two factors related to global warming: the added water coming from the melting of land ice, and the expansion of sea water as it warms up. The above graphs show how much sea level has changed since 1993 (right, satellite data record) and about 1880 (left, coastal tide gauge data).
NASA 2013
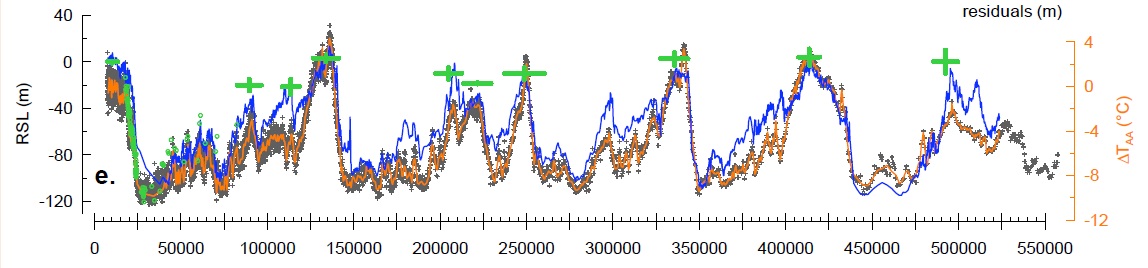
Figure 11. Sea level (blue, green: scale on the left) and Antarctic air temperature (orange, gray: scale on the right) over the last 550,000 years, from paleo-records (from right to left: present-day on the left). Sea level varied between about 110 m below and 10 m above present, while air temperature in Antarctica varied between about 10°C below and 4°C above present, with a very good correlation between both quantities. Variations in Antarctic air temperature are about two-fold those of global mean air temperature. From the World Bank Turn Down the Heat Report 2010.
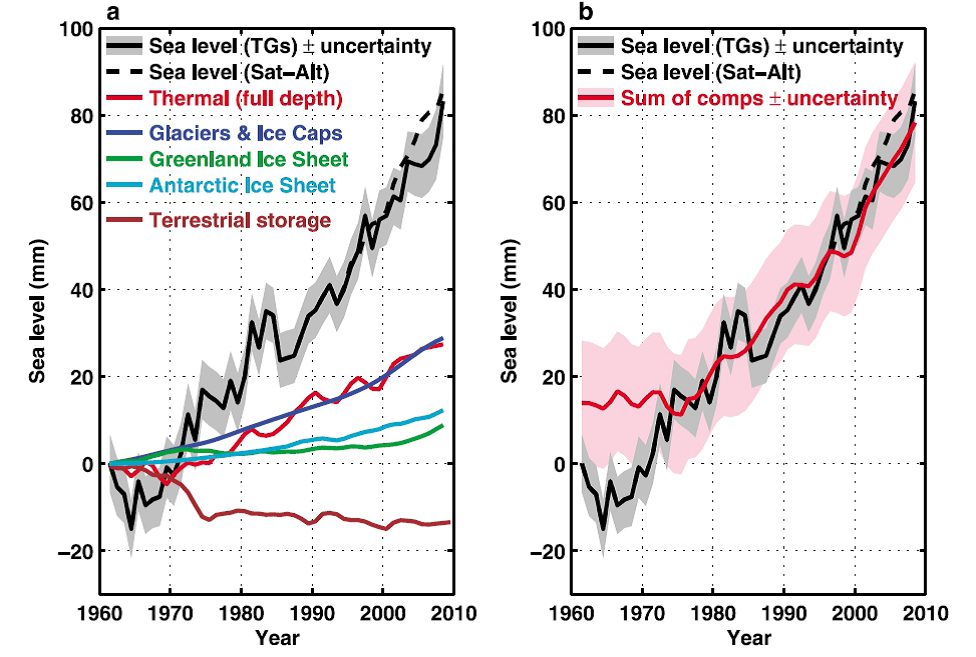
Figure 12: Left panel (a): The contributions of land ice (mountain glaciers and ice caps and Greenland and Antarctic ice sheets), thermosteric sea level rise, and terrestrial storage (the net effects of groundwater extraction and dam building), as well as observations from tide gauges (since 1961) and satellite observations (since 1993). Right panel (b): the sum of the individual contributions approximates the observed sea-level rise since the 1970s. The gaps in the earlier period could be caused by errors in observations. World Bank 2012 Turn Down the Heat
Find out more:
- AMAP. (2011) Snow, Water, Ice and Permafrost in the Arctic (SWIPA): Climate Change and the Cryosphere. Arctic Monitoring and Assessment Programme (AMAP), Oslo, Norway. Xii + 538pp.
- AMAP, 2012. Arctic Climate Issues 2011: Changes in Arctic Snow, Water, Ice and Permafrost. SWIPA 2011 Overview Report. AMAPs 2011 assessment of the Arctic Cryosphere (the SWIPA assessment) updates information presented in the 2004/5 Arctic Climate Impact Assessment.
- Hallegatte, S., Green, C., Nicholls, R.J. and Corfee-Morlot, J. (2013) Future flood losses in major coastal cities. Nature Climate Change 3, 802–806 (2013) doi:10.1038/nclimate1979
- NASA
- National Snow and Ice Data Centre (NISDC)
- NOAA Sea Level Rise and Coastal Flooding Impacts Viewer
- Pfeffer W. et al. 2008. Kinematic Constraints on Glacier Contributions to 21st- Century Sea-Level
- Rahmstorf, S., Cazenave, A., Church, J. A., Hansen, J. E., Keeling, R. F., Parker, D. E. and Somerville, R. C. J. (2007) Recent climate observations compared to projections. Science 316: 709.
- Rignot,E., Velicogna,I., van den Broeke,M.R., Monaghan, A. and Lenaerts, J. (2011) Acceleration of the contribution of the Greenland and Antarctic ice sheets to sea level rise
- World Bank (2010) Turn down the Heat. Why a 4 degree centigrade warmer world must be avoided.